
Figure 2.
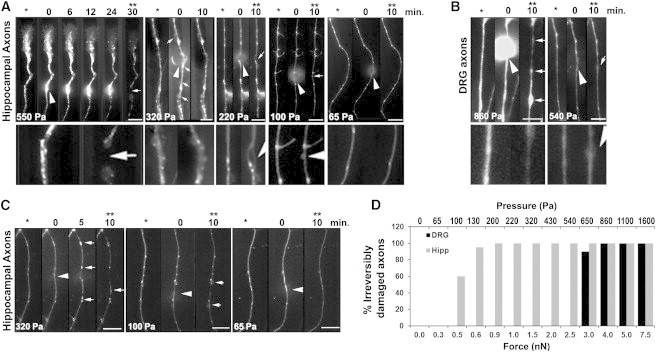
DRG axons are more resistant to compression than hippocampal axons. Higher pressures induce the formation of FAS and axonal deformities (arrows). (Arrowheads) Location of compression. The images are oriented such that the cell soma lies below the axonal segment shown in the panels. Scale bar, 10 μm. (A) Mitochondria were fluorescently labeled and single axons were compressed with a bead attached to the AFM cantilever with pressures ranging from 65 to 550 Pa for 10–30 min. Images taken before (∗), during, and after compression (∗∗) show that hippocampal axons do not recover axonal shape and mitochondria transport after compression release when compressed with pressures >65 Pa for 10 min. (Lower panels) 3× zoom of the compression region of the axons before compression and after compression release. Each panel represents one axon but at least 10 axons were tested in each condition with similar results. (B) DRG axons completely recovered after compression with 540 Pa for 10 min, but formed FAS along the whole axon when compressed with higher pressures (arrows). Each panel represents one axon but at least eight axons were tested in each condition with similar results. (C) The same compression experiment as in panel A was performed with hippocampal axons fluorescently labeled with Tubulin Tracker (Invitrogen), revealing the formation of FAS containing tubulin when pressure exceeds 65 Pa. Each panel represents one axon but at least eight axons were tested in each condition with similar results. (D) Quantification of the irreversibly damaged hippocampal or DRG axons after compression with different forces (±20%) and the corresponding estimated pressures (±40%) calculated based on the axonal diameter. Each bar represents the result of at least five axons tested under the same conditions.