
Figure 3.
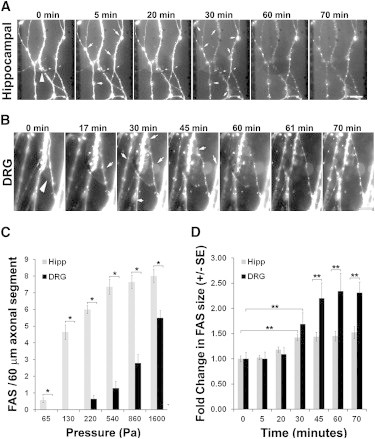
Progressive formation of FAS during axonal compression. (A) Mitochondria were fluorescently labeled and hippocampal axons were compressed for 60 min with 540 ± 220 Pa under a tipless AFM cantilever. (B) DRG axons were compressed with 1100 ± 440 Pa in the same conditions as in A. (Arrowheads) Compression site. (Arrows) Newly appearing FAS or increase in FAS size during compression. Soma lies below the axonal segment shown in the panels. Scale bar, 10 μm. (C) Plot showing the average number mean ± SE of FAS formed in each 60-μm axonal segment (n = 14) after compression of hippocampal and DRG axons for 10 min with different pressures (∗p < 0.001). (D) Increase in the size of FAS during compression of hippocampal and DRG axons for 60 min with 540 and 1500 Pa, respectively. The increase in FAS area was determined by setting a region of interest corresponding to each FAS at the end of compression, then using the National Institutes of Health software Image J (44), to measure the fluorescent area in each region of interest over the images acquired at different time points, enabling the calculation of the increase in the area of FAS during compression. Each bar corresponds to the average ± SE of the increase in the area of at least 20 FAS during compression (∗∗p < 0.05).