
Figure 4.
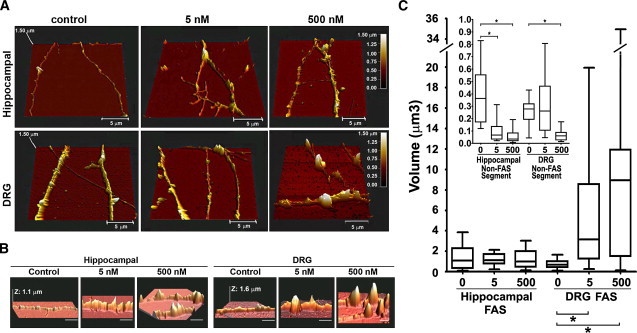
Progressive formation of FAS during gradual impairment of axonal transport. (A) Hippocampal and DRG axons not treated (control) or treated with 5 nM or 500 nM vinblastine for 1 h were fixed and imaged with the AFM. (B) Same as panel A, but focusing on FAS. Horizontal scale bar, 5 μm. (C) Box-and-whiskers plot showing the minimum and maximal volume of each FAS formed by hippocampal and DRG axons treated with increasing concentrations of vinblastine. (Inset) Box-and-whiskers plot of the minimum and maximal volume of an axonal segment between FAS (∗p < 0.0001). At least 23 axons were imaged and measured for each experimental condition.