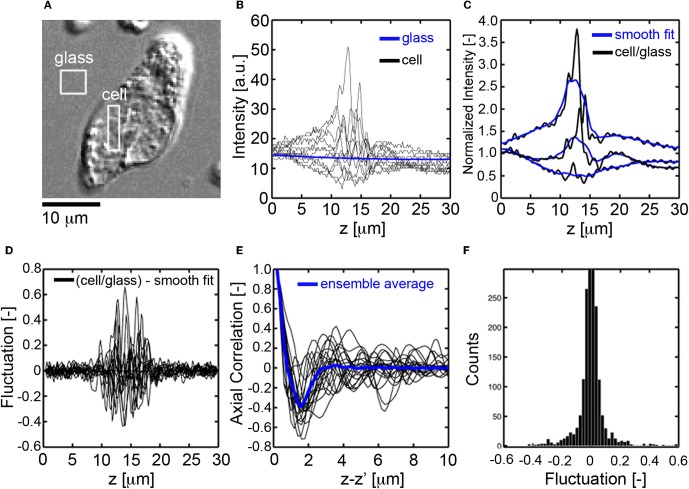
Figure 2.
Fluctuation and spatial correlation analysis of axial DIC intensity profiles. (A) En face DIC image CTC. (B) Axial profiles of DIC intensity for pixels in the cell (black) and glass substrate (blue), (C) normalized DIC intensity profile (black, cell signal divided by glass signal) for pixels inside the cell and corresponding smooth fit (blue), (D) fluctuating part of the DIC intensity (normalized signal minus smooth fit), (E) autocorrelation function of the fluctuating part of the DIC signal, the correlation length Lc[μm] is defined as the first zero crossing, (F) histogram of the fluctuating part of the DIC intensity, the mass-density fluctuations are quantified through the standard deviation, σA[−], of the histogram.

