Figure 3.
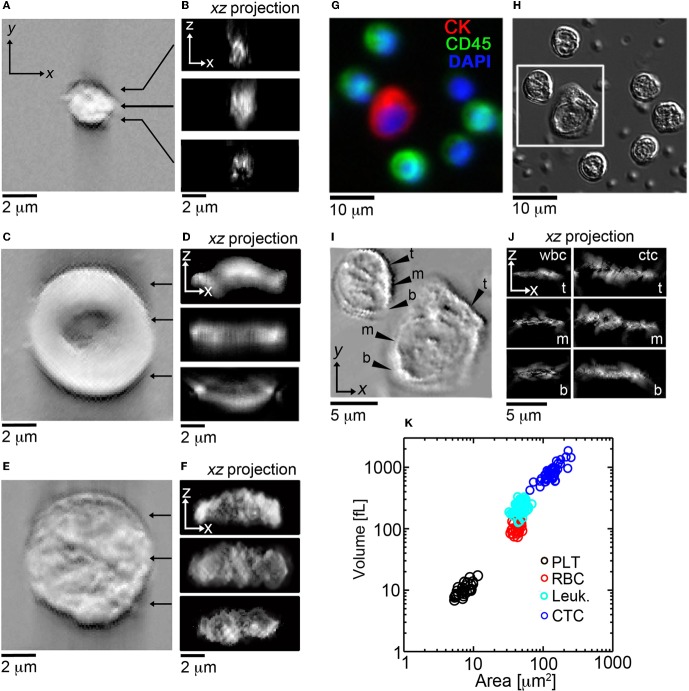
En face and cross sectional post-processed DIC images of normal blood cell populations and HD-CTCs. Representative en face and sagittal Hilbert transformed DIC images of (A,B) PLT, (C,D) RBC, (E,F) leukocytes. (G) Merged fluorescence image of HD-CTCs and leukocytes from breast cancer patient, (H) corresponding DIC image, (I) corresponding Hilbert transformed DIC image, (J) corresponding cross sectional images at the t, top; m, middle; b, bottom locations denoted in (I). (K) Scatter plot of cell areas vs. corresponding volume for each cell type.

