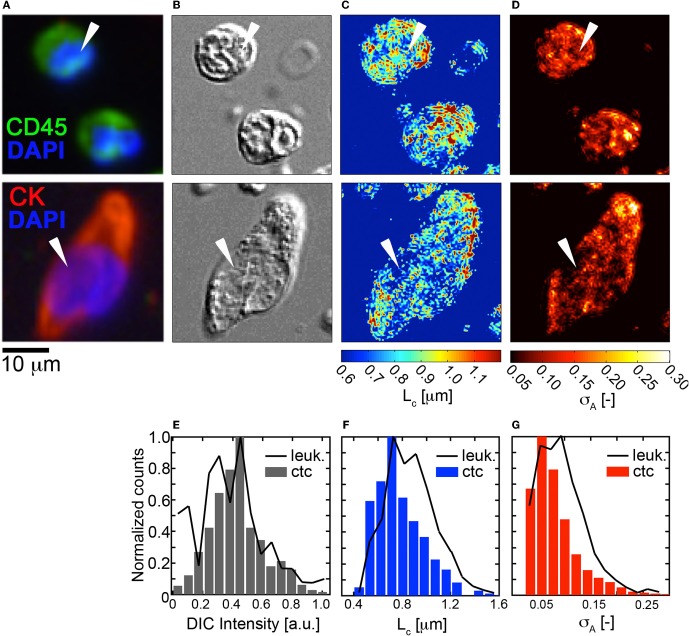
Figure 4.
Fluctuation and spatial correlation maps: comparison of HD-CTCs and leukocytes. (A) Merged fluorescence image of HD-CTCs and leukocytes, (B) corresponding DIC images, (C) spatial correlation length map, (D) density amplitude fluctuation map, (E) histogram of DIC intensity of cells indicated with white arrows in (B). (F) HD-CTC and leukocyte LC histograms of cells indicated in (C). (G) HD-CTC and leukocyte σA histograms of cells indicated in (D).

