
Figure 7.
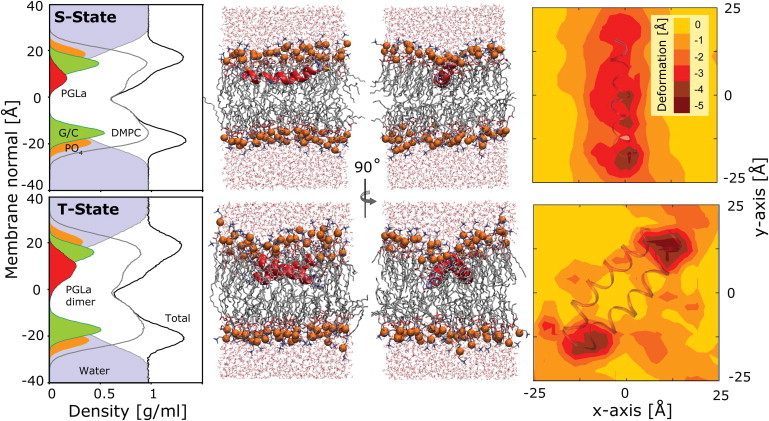
Insertion depth and bilayer deformation of PGLa in a DMPC lipid bilayer in the S-state and the T-state (OPLS runs). Plots of the density cross section reveal the peptide to be deeply inserted, below the lipid phosphate (PO4) and glycerol/carbonyl (G/C) groups. Representative snapshots are shown to scale, with the phosphate groups highlighted as orange beads. The bilayer surface distortion induced by the PGLa peptide is illustrated on the right. The contour plots show the rotationally adjusted deviation in the time-averaged phosphate distance from the center of the bilayer for the leaflet containing the peptide. The peptides cause a significant local thinning (up to −5 Å) of the membrane. Results for the CHARMM simulations are similar.