
Figure 2.
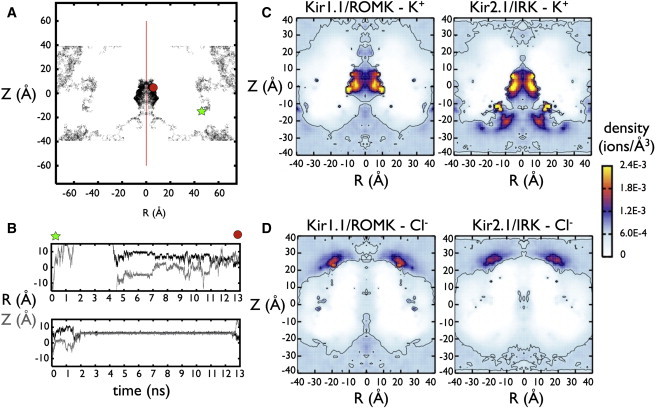
K+ and Cl− in Kir1.1/ROMK and Kir2.1/IRK cytoplasmic domains. (A) An example K+ ion trajectory from one Kir2.1/IRK simulation. This trajectory and subsequent density plots are shown as functions of radial distance from the pore axis (R = sqrt(X2+Y2)) and height in the simulation box (Z). For a clearer visualization of the cytoplasmic pore structure, all plots are represented for the real values of R > 0 Å, as well as the mirror image defined for R < 0 Å, along the pore-axis symmetry line (red). In this trajectory, the K+ ion starts at position (R, Z) = (47.7 Å, −11.3 Å), represented by a symbol (green star) where it travels around the bulk and exits the top of the simulation box. Under periodic boundary conditions, the same ion reenters at the bottom of the cell (i.e., Z = −60 Å and Z = 60 Å are identical) and then finds its way into the cytoplasmic pore (R < 15 Å, −9 Å < Z < 15 Å) where it remains until the end of the simulation (red circle). (B) Two example time series of K+ inside the Kir2.1/IRK pore, with radial position R (black) and pore position Z (gray). The top time series is the same trajectory from panel A, showing the ion entering the pore and jumping from stationary sites along the protein surface. The bottom time series is another ion from the same simulation, showing a long-lived interaction, which exits the pore at the end of the simulation. (C) K+ and (D) Cl− density distributions in Kir1.1/ROMK and Kir2.1/IRK. The density plots are calculated for each simulation and then averaged between three separate runs. A molecular density of ρ = 6.022 × 10⁻⁴ ions/Å3 corresponds to 1 M concentration. Contours are shown for densities corresponding to 1 and 2.5 M.