
Figure 4.
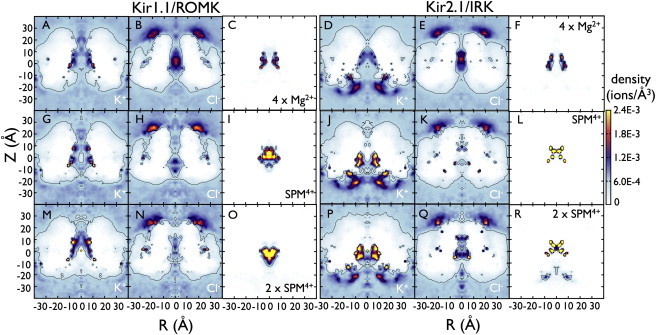
K+ and Cl− densities in the presence of rectification blockers Mg2+ and SPM4+. Density plots of: K+ (A) and Cl− (B) with 4 Mg2+ ions inside the CD of ROMK (C); K+ (D) and Cl− (E) with 4 Mg2+ ions inside the CD of IRK (F). Each plot was calculated from an average over three simulations. Density plots of: K+ (G), Cl− (H), and SPM4+ (I) in a single structural model of ROMK; K+ (J), Cl− (K), and SPM4+ (L) in a single structural model of IRK. Averaged density plots for single spermine simulations are shown in Fig. S9. Density plots of K+, Cl−, and SPM4+ after an additional spermine molecule is added along the pore from −24 Å < Z < −6 Å and simulated for 10 ns: K+ (M), Cl− (N), and SPM4+ (O) in ROMK, and K+ (P), Cl− (Q), and SPM4+ (R) in IRK. The spermine densities are calculated using the nitrogen atoms (N1, N2, N3, N4) as the ions. A molecular density of ρ = 6.022 × 10⁻⁴ ions/Å3 is equivalent to 1 M concentration, and contours are shown for densities corresponding to 1 and 2.5 M. Note that whereas K+ and Cl− adequately sample the system and converge to 1 M in the bulk, Mg2+ and SPM4+ remain mainly in the pore throughout the simulations. Therefore, the Mg2+ and SPM4+ distributions can only be interpreted as local densities and do not represent equilibrium.