Figure 1.

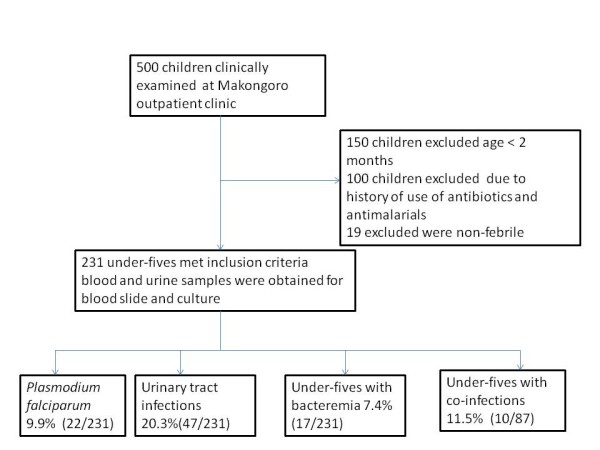
Flow chart summarizing the number of children seen at Makongoro clinic during the study period and infections prevalences among 231 under-fives in Mwanza, Tanzania 2011.

Flow chart summarizing the number of children seen at Makongoro clinic during the study period and infections prevalences among 231 under-fives in Mwanza, Tanzania 2011.