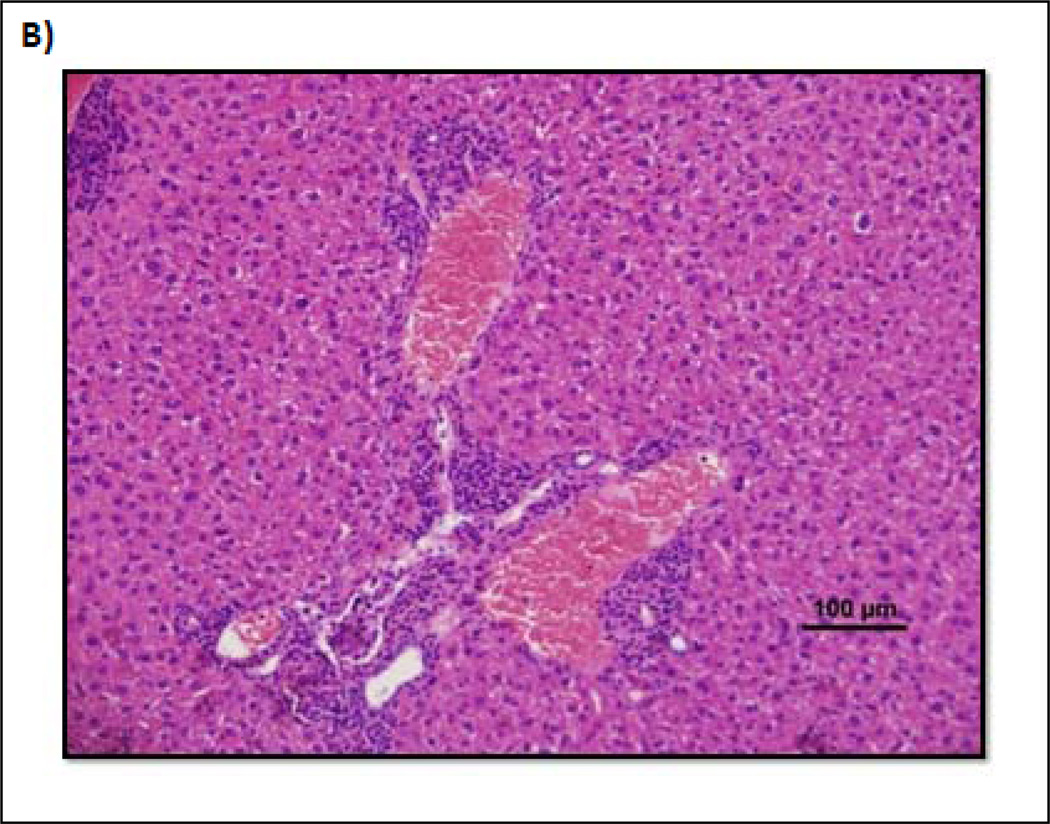
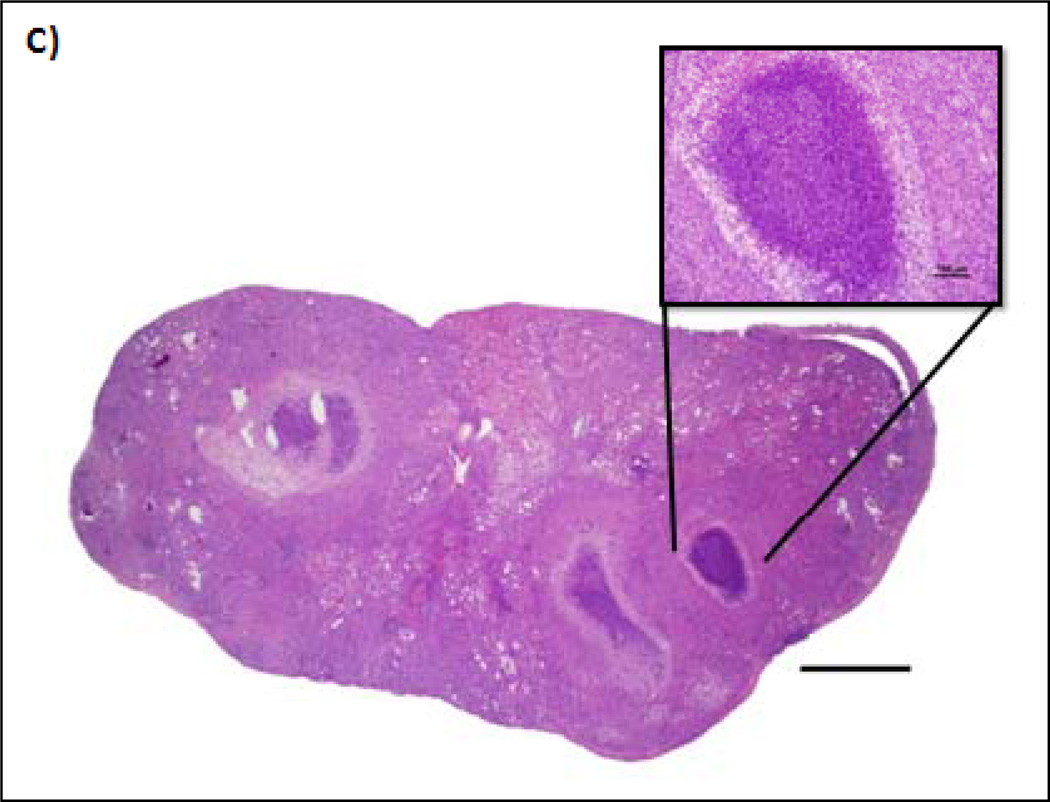
Fig. 4.
Changes in total WBC in response to ttIL-12 over time. A, Chart depicting the change in total white blood cell count for each group over time. *Indicates significant change in total WBC. B, Photomicrograph from one of the mice in the 30 day 5 µg treatment group depicting a subacute moderate diffuse pericholangitis or portal hepatitis. C, Kidney photomicrograph from another mouse in the 30 day 5 µg treatment group depicting a severe, diffuse, subacute to chronic, pyogranulomatous pyelonephritis effacing the entire kidney. Hematoxylin and eosin staining of paraffin-embedded formalin-fixed tissue.


