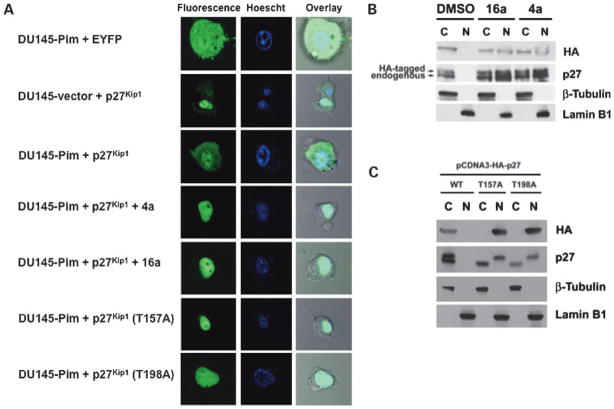
Figure 5.
Pim-1 overexpression increases the amount of cytoplasmic p27Kip1 and 4a and 16a reduce this Pim-mediated effect. A, DU145-vector and DU145-Pim cells were transfected with the control EYFP, EYFP-p27Kip1, EYFP-p27Kip1 (T157A), or EYFP-p27Kip1 (T198A) plasmids. Transfected DU145-Pim cells were then treated with 4a (5 μmol/L) or 16a (5 μmol/L) for 24 h. p27Kip1 was visualized in live cells using a fluorescence microscope as described in Materials and Methods. The overlay lane places the fluorescent image on the top of the phase-contrast microscopic image in identical cells. B, K562 cells were transfected with HA-tagged p27Kip1 and treated with 4a (5 μmol/L) or 16a (5 μmol/L) for 24 h. Cytoplasmic and nuclear fractions were prepared as described in Materials and Methods, and the level of p27Kip1 in the cytoplasmic and nuclear fraction was determined by SDS-PAGE followed by Western blotting. β-Tubulin and lamin B1 serve as cytoplasmic and nuclear markers, respectively. C, K562 cells were transfected with HA-tagged wild-type p27Kip1 (WT), T157A-p27Kip1, or T198A-p27Kip1. Cytoplasmic and nuclear fractions were prepared as described in Materials and Methods, and the level of wild-type and mutant p27Kip1 protein in the cytoplasmic and nuclear fractions were determined by SDS-PAGE followed by Western blotting. The two bands of different size observed in the blot probed with the antibody to p27 in both B and C correspond to HA-tagged (top) and endogenous (bottom) p27Kip1.

