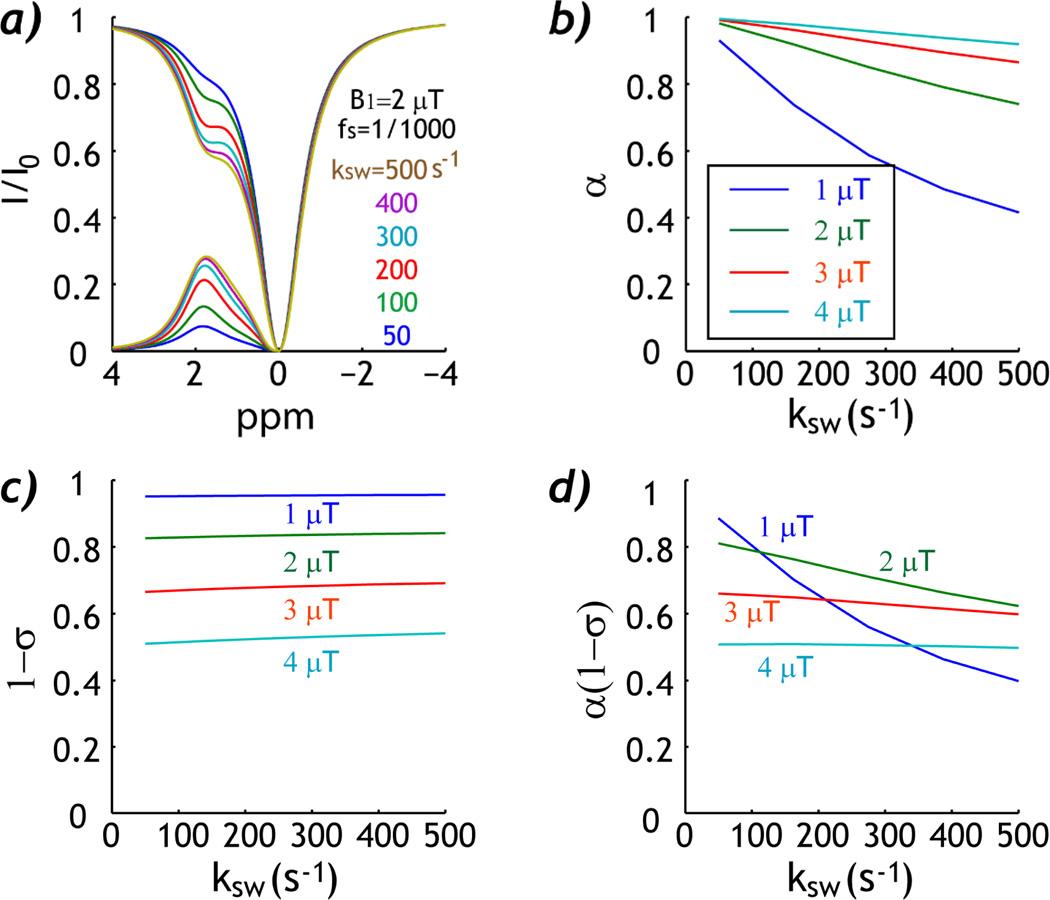
Fig. 2.
Simulation of the experimental factor as a function of chemical exchange rate (ksw). a) Z-spectra show increased CEST contrast at higher exchange rate. b) Labeling coefficient decreases with exchange rate. c) RF Spillover factor remains approximately constant as a function of exchange rate. d) The experimental factor decreases with exchange rate, yet remains relatively constant for intermediate B1 irradiation field (3–4 µT).

