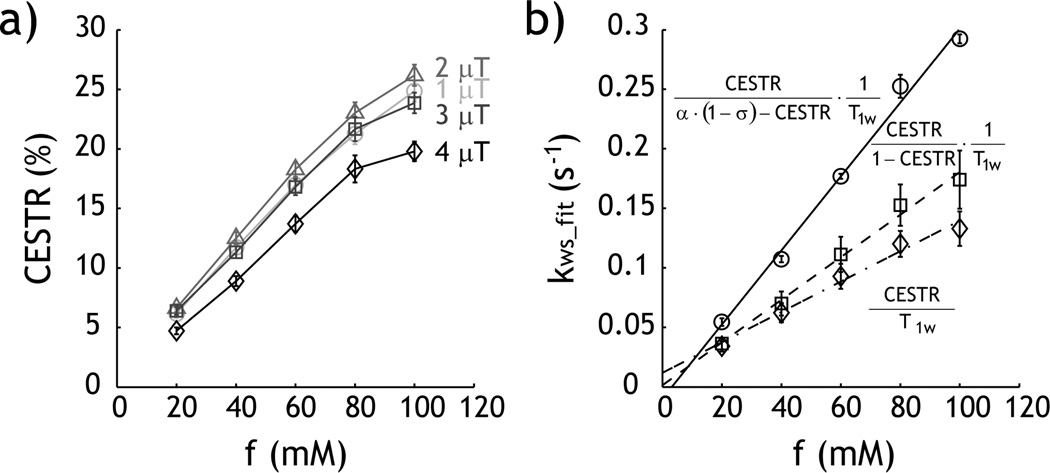
Fig. 5.
Evaluation of the proposed quantitative CEST MRI. a) The experimentally obtained CEST contrast initially increases with RF power from 1 to 2 µT, and decreases when higher RF power was used. b) Comparison of kws solution from the first-order approximation of simplistic solution (diamond), the simplistic solution (square), and the proposed experimental factor-compensated solution (circle).

