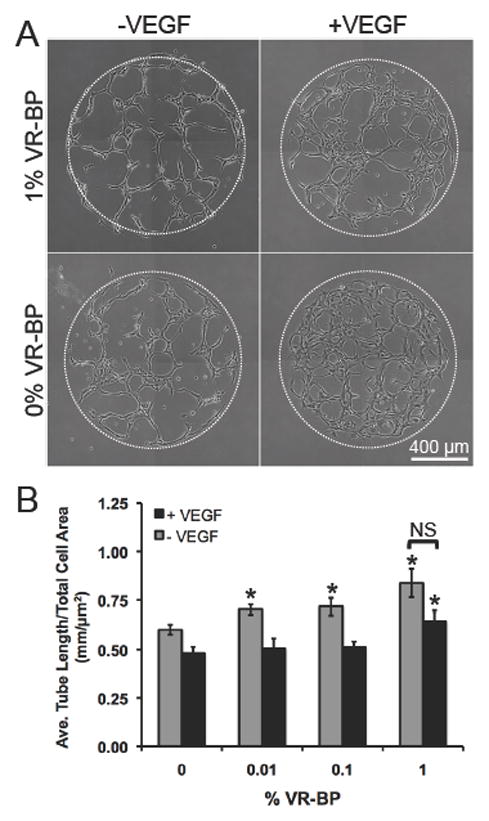
Figure 8.

HUVEC tubulogenesis on surfaces presenting 5% GRGDSP and covalently immobilized VR-BP. (A) HUVECs on SAM arrays were placed on a thin layer of matrigel with and without 100 ng/mL VEGF and imaged for over 24 hrs (See Supplemental Movies 1A–D). (B) Tubulogenesis was quantified by averaging the length of all objects in each array spot and normalizing by total area occupied by cells. (Error bars represent standard error of the mean. Asterisk indicates significant increase compared to 0% VR-BP and “NS” indicates no significance between soluble VEGF conditions, p < 0.05)
