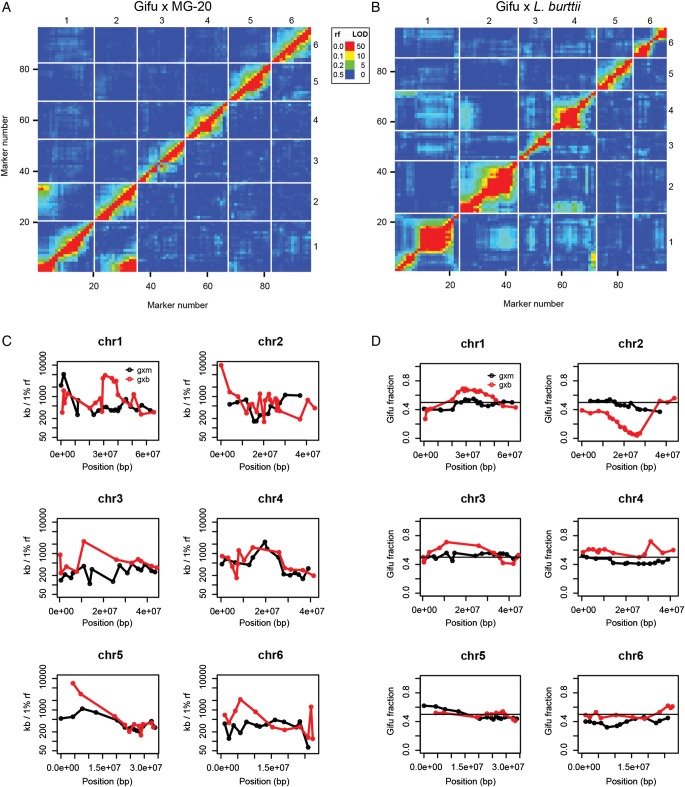
Figure 1.
Marker linkage and recombination landscapes for Gifu × MG-20 and Gifu × L. burttii RIL populations. (A and B) Recombination fractions (rf) and LOD scores for all marker pairs. Recombination fractions are in the upper left triangle and the LOD scores are in the lower right triangle. The LOD scores are for a test of r = 0.5. Red corresponds to a large LOD or a small recombination fraction, indicating a strong marker linkage, while blue is the reverse. Missing values appear in light grey. All plotted values are listed in Supplementary Tables S3 and S4. (A) Gifu × MG-20 RILs. (B) Gifu × L. burttii RILs. (C) The physical distance (in kb) corresponding to a recombination fraction of 1% is plotted at each marker position. A high value indicates a low rate of recombination. (D) The fraction of L. japonicus Gifu genotypes at each marker position is plotted. A fraction of 0.5 (black line) is expected in the absence of segregation distortion.

