
Figure 6.
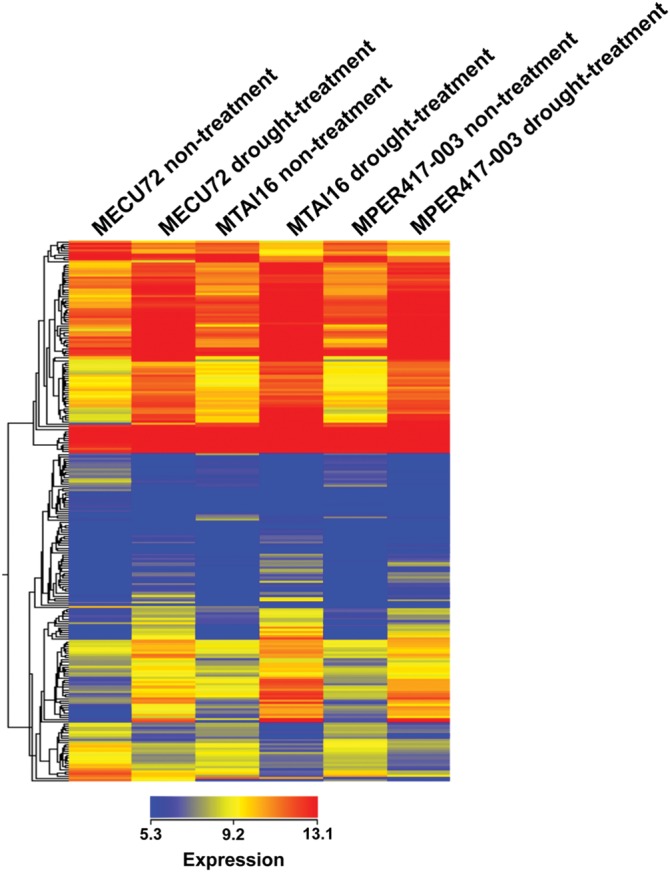
Hierarchical clustering analysis of the genes up-regulated (168 genes) and down-regulated (69 genes) by drought stress treatment in the three cassava genotypes. The signal intensity values for each sample were transformed to log2 values and subjected to hierarchical clustering using standard correlation. The genes with higher and lower signal intensity values are shown in red and blue, respectively. The genes with the signal intensity value of a median level are shown in yellow.