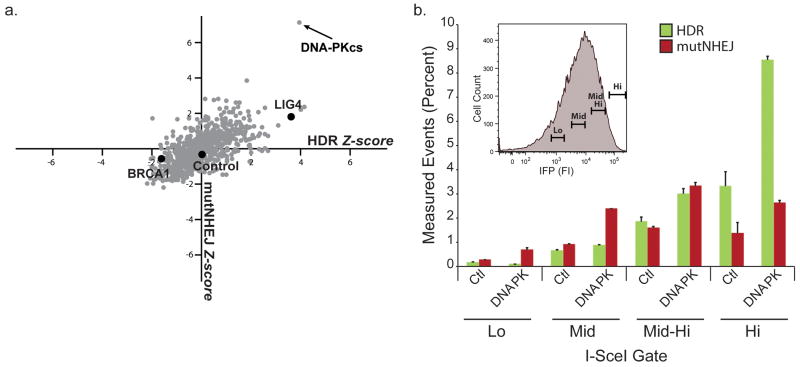
Figure 5. High-throughput siRNA kinome screen to identify modifiers of engineering outcome.
(a) Scatter plot of gene targeting and mutNHEJ Z scores obtained from the siRNA screen. Library in gray, Control siRNAs in black. Control siRNA values are average of at least 3 independent transfections. (b) Gating analysis comparing TLR readout from control and DNA-PKcs siRNA treatment as a function of nuclease expression 72hrs after transduction of HEK293 TLRsce I-SceI-T2A-IFP LV. Inset histogram shows nuclease expression gates. Data are derived from 3 independent experiments performed in duplicate.

