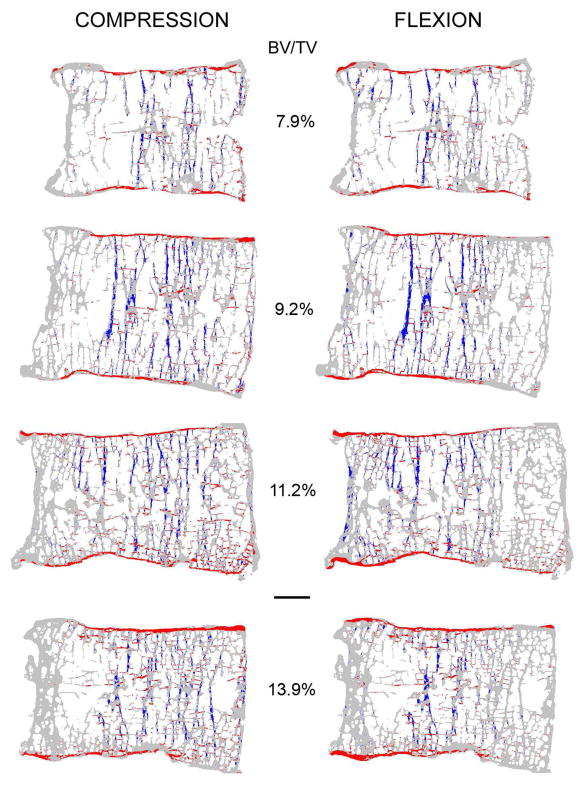
Fig. 3.
Mid-sagittal sections from four vertebrae with increasing bone volume fraction (BV/TV) from top to bottom showing the distribution of high-risk tissue (compressive tissue-level failure is blue and tensile tissue-level failure is red). Note that the trabeculae, cortical shell, endplates and cortical rim appear thicker than they actually are because all of the bone tissue in this 0.5 mm-thick section is projected onto a single plane. Scale bar: 5 mm.

