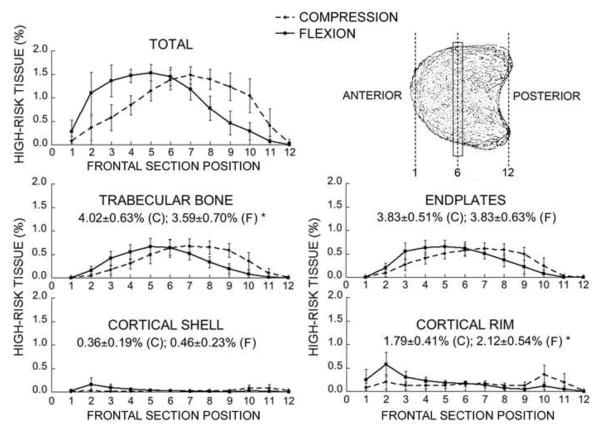
Fig. 4.
Mean variation in the amount of high-risk tissue across frontal sections for the total vertebral bone and for each compartment. By definition, all values add up to 10% (see text). * Comparisons between compression (C) and flexion (F) were significantly different (p < 0.001 by paired t-test). Bars show ± 1 SD for n = 22 specimens.

