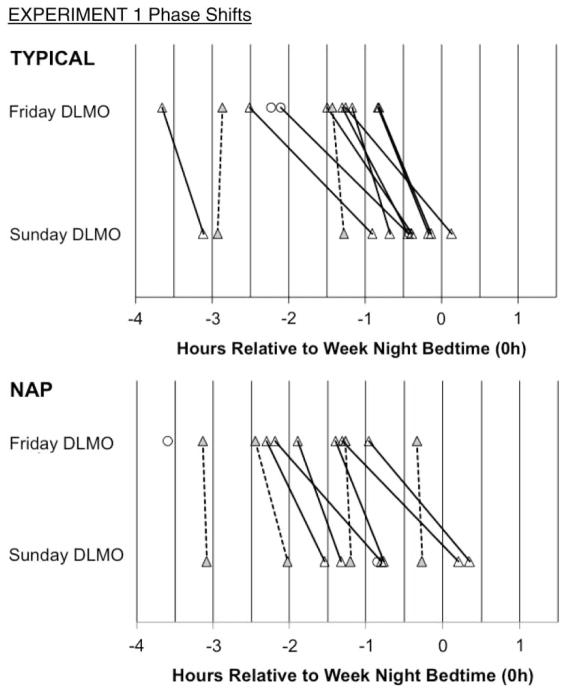
FIGURE 2.
Individual DLMO phases measured on Friday and Sunday evenings are plotted relative to scheduled bedtime on school nights (negative = earlier than bedtime; positive = later than bedtime) for Experiment 1. Lines connect Friday and Sunday values to illustrate individual phase shifts; however, we do not assume a linear time trajectory. Solid lines indicate a phase delay shift ≥30 min, and hashed lines indicate a phase delay shift <30 min. Circles illustrate those whose incomplete DLMO on a night excluded them from statistical analyses.

