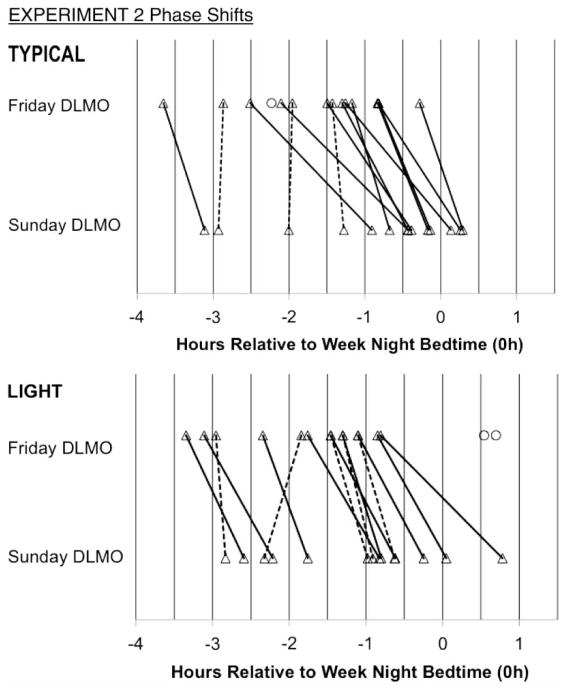
FIGURE 3.
Individual DLMO phases measured on Friday and Sunday evenings are plotted relative to scheduled bedtime on school nights of Experiment 2. Lines connect Friday and Sunday values to illustrate individual phase shifts; however, we do not assume a linear trajectory. Solid lines indicate a phase delay shift ≥30 min, and hashed lines indicate a phase delay shift <30 min or a phase advance shift (n = 1 in LIGHT group; phase shift = +29 min). Circles illustrate those whose incomplete DLMO on a night excluded them from statistical analyses. DLMO phase shifts from participants in the TYPICAL condition of Experiment 1 are included in the TYPICAL group of Experiment 2.

