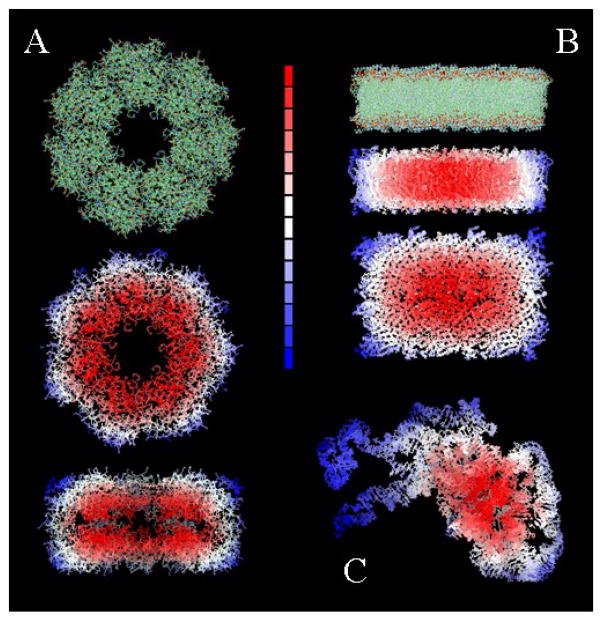
Figure 1.
Representation of water-exclusion effects for: (A) a multi-protein assembly; (B) a rectangular slice of lipid bilayer; and (C) a bundle of RNA. Regions more excluded from water are colored red [larger δα in Eq.(9)], and regions more exposed to water are colored blue (smaller δα). Similar behavior could be illustrated for δα′i and δα′j in Eq.(15).

