
Figure 9. Reduced state space of fly locomotion behavior after PCA separates the three experimental conditions.
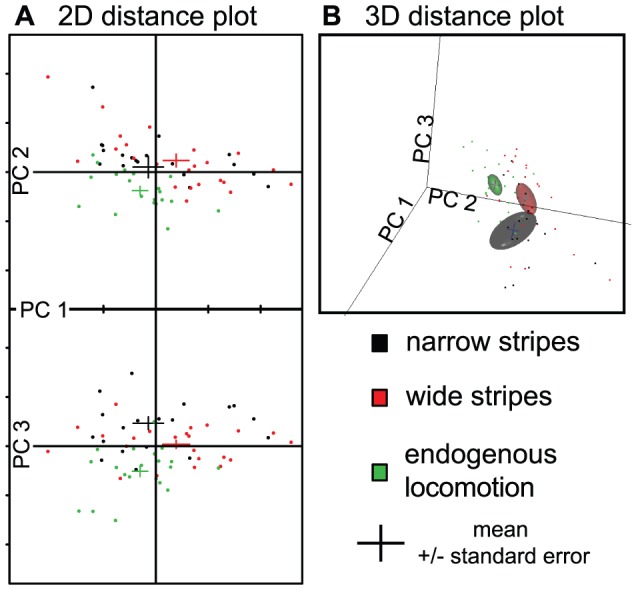
A. 2D scatter plot showing each fly as a dot, and the mean and standard error of the factor loadings as bars. Abscissa is the first principal component (PC1). Ordinate is PC2 on the upper panel and PC3 on the lower panel. B. Snapshot of the corresponding 3D representation plot. Each dot corresponds to a fly coordinate, bars are means and standard errors, and the ellipsoids represent the 80% confidence interval (calculated from the covariance using the loadings on the three first principal components).