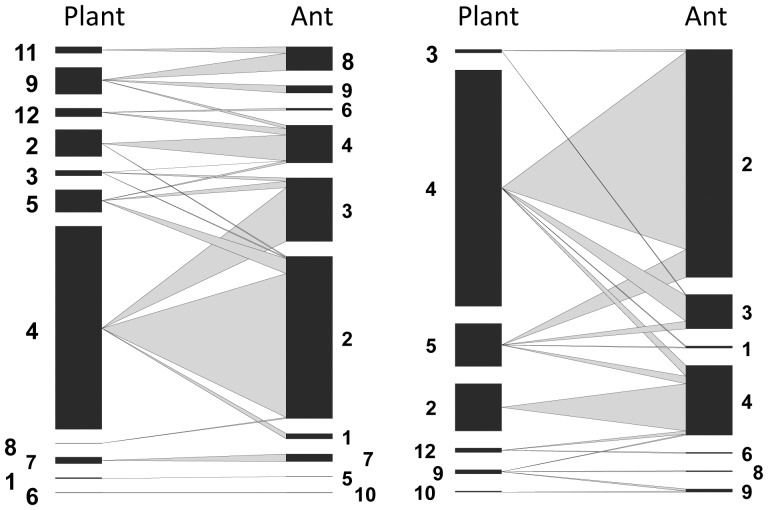
Figure 1. Networks for Continuous Forest (left) and Forest Fragment (right) based on data pooled across all sites.
For each network vertical bars on the left represent plant abundance and bars on the right represent ant abundance; the width of the grey lines connecting them represents the frequency of that interaction. Ant species: 1 Allomerus decemarticulatus, 2 Allomerus octoarticulatus, 3 Allomerus septemarticulatus, 4 Azteca spp., 5 Camponotus balzani, 6 Crematogaster laevis, 7 Myrcidris epicharis, 8 Pseudomyrmex concolor, 9 Pseudomyrmex nigrescens, 10 Pheidole minutula. Plant species: 1 Cecropia purpurascens, 2 Cordia nodosa, 3 Duroia saccifera, 4 Hirtella myrmecophila, 5 Hirtella physophora, 6 Maieta guianensis, 7 Myrcia madida, 8 Porouma spp., 9 Tachigali myrmecophila, 10 Tachigali pumblea, 11 Tachigali venusta, 12 Tococa bullifera.

