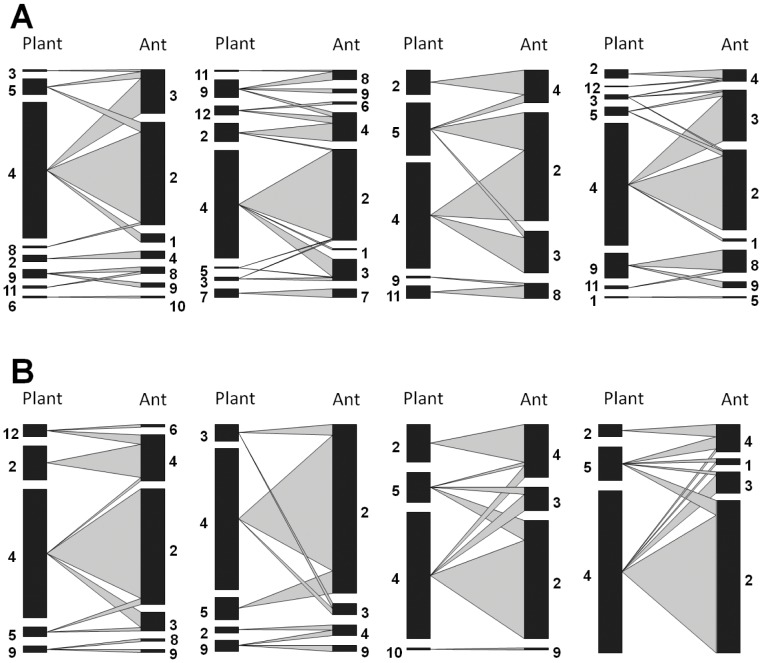
Figure 2. Ant-plant networks for individual plots.
For each network, the bars on left represent plant species and bars on the right represent ant species; the width of the grey lines connecting them represents the frequency of that interaction. (A) Plots in Continuous Forest (CF), from left to right: “Camp 41”, “Dimona”, “Florestal” and “Porto Alegre”. (B). Plots in Forest Fragments (FF), from left to right: “Porto Alegre”, “Colosso”, “2108” and “2107”. See Bruna et al. [31] for the location and description of these sites; for a key to the plant and ant species see Figure 1.

