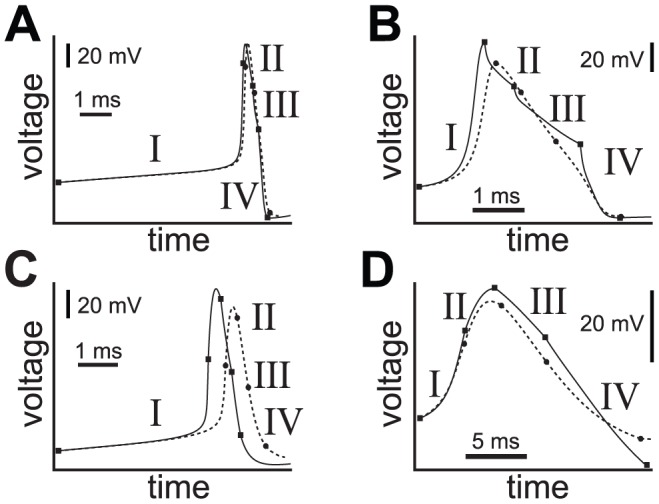
Figure 6. Voltage trace fits for various hybrid AP models.

Voltage traces versus time summarize the qualitative fit of four smooth biophysical models of APs (solid lines) with their hybrid counterparts (dashed lines). The four sub-model regimes of the AP are indicated with Roman numerals, with onsets indicated by solid square or circular markers. A) The fast interneuron model studied here. B) Original Hodgkin-Huxley parameters. C) A Wang-Buzsáki form of interneuron. D) A heart interneuron model with a larger set of sub-threshold and AP ionic currents. Adapted from Figure 7 of Clewley [46] , in which full model and analysis details can be found.
