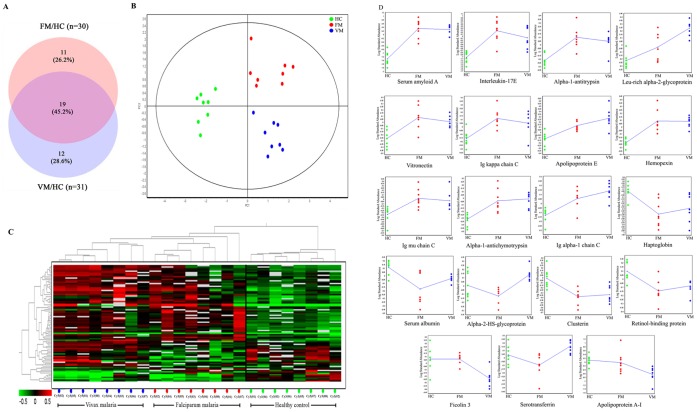
Figure 2. Comparative analysis of falciparum and vivax malaria.
(A) Venn diagram showing the number of proteins differentially expressed in FM and VM, among which 46.2% were found to be common. (B) PCA analysis shows the clustering of different spot maps (green-HC, red-FM, blue-VM group). The PC1 component separates the control group from the rest, and the PC2 clusters the diseased groups separately. Proteins which participated in PCA analysis were present in at least 80% of the spot maps and passed the filter of one-way ANOVA (p<0.01) test. (C) The dendrogram showing the separation of different experimental groups after the hierarchical cluster analysis (red - up-regulated, green - down-regulated and black – no significant change in expression level). The spot maps are clustered together for each experimental group (HC, FM and VM). (D) Trend of differentially expressed proteins in malaria patients represented as standardized log abundance of spot intensity in FM, VM and HC cohort of the study. Compared to HC, all of the identified proteins (except serotransferrin and alpha-2-HS-glycoprotein) exhibited similar trend of differential expression in FM and VM; however, fold-change values are different.

