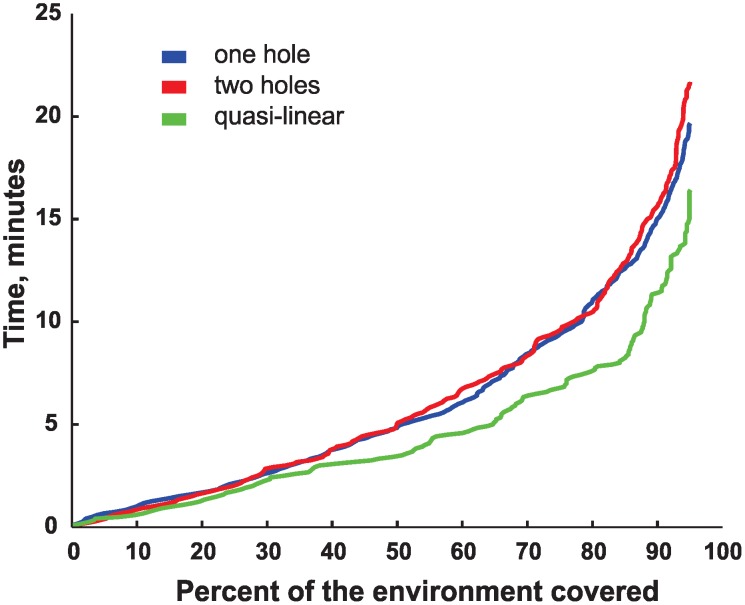
Figure 6. Ergodicity times for the three environments shown in Figure 4 .
For each environment, the graph shows how much time is required to cover a certain percentage of the 3×3 cm spatial bins. This ergodic time scale shows that it takes approximately ten minutes for a rat to cover 80% of the environment; by comparison, the topological map formation time for stable regimes is much lower.

