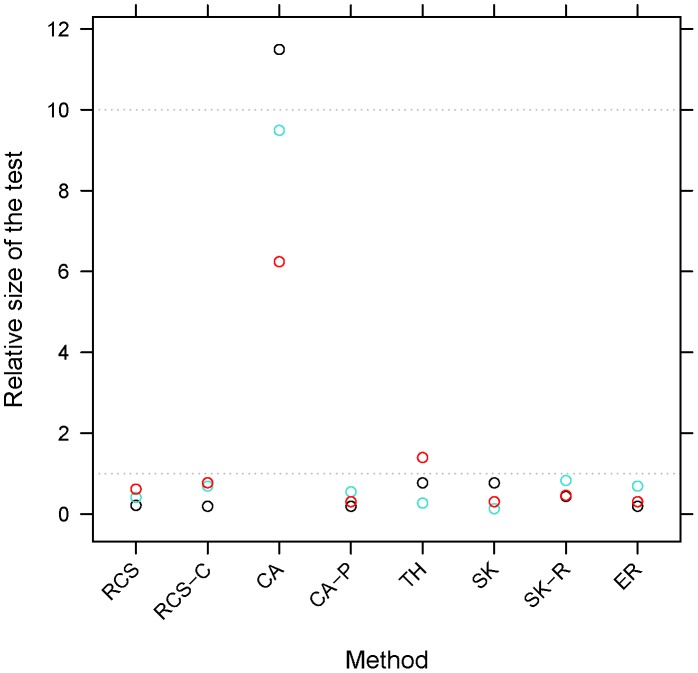
Figure 1. Relative size of the test* for 1000 cases and 1000 controls at a type I error of 10−3.
The size of the test estimated empirically from 25,000 simulations. Black, turquoise and red circles correspond to gene CDS equal to 10, 50, and 90 percentiles of the human gene CDS distribution, respectively. Methods: RCS – (logistic) regression on carriage status, RCS-C – (logistic) regression on carriage status and covariates, CA – C-alpha test, CA-P – C-alpha test with permutations, TH – test of trend and heterogeneity, SK – SKAT, SK-R – SKAT with (parametric bootstrap) resampling, ER – EREC. *The ratio of the size of the test to the nominal type I error rate.

