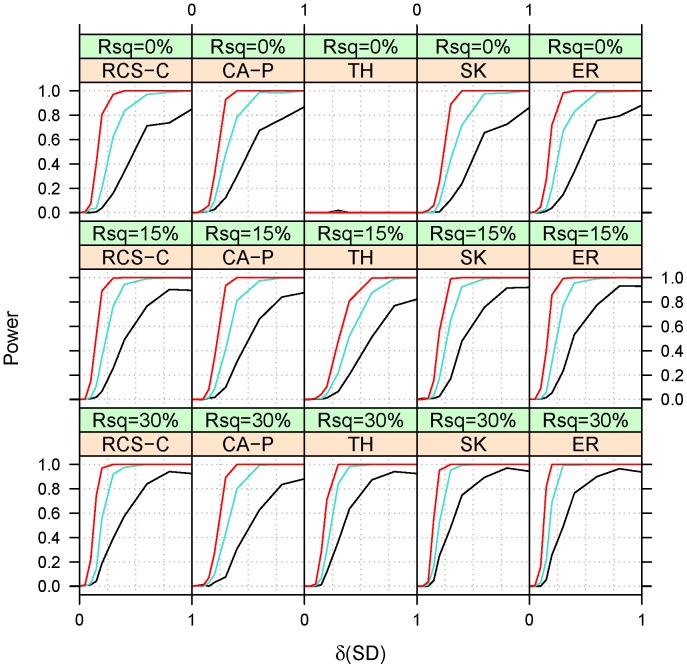
Figure 2. Empirical power at a type I error of 10−3 for Scenario 1 under homogeneity (ξ = 1).
The power estimated from 250 simulations. The covariate is assumed to be explaining a fraction (Rsq) equal to 0, 10 or 20% of the variability in binary trait. Power is presented for 10% (black), 50% (turquoise) and 90% (red) percentiles of CDS length. See Fig. 1 for background and abbreviation.

