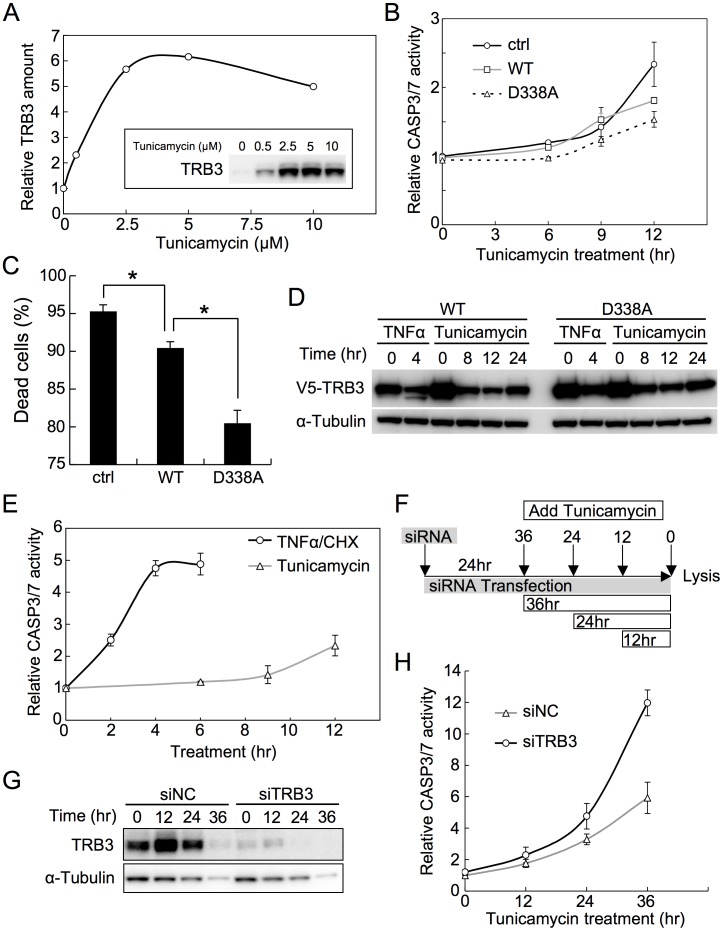
Figure 3. TRB3 inhibits CASP3 activation and subsequent apoptosis under ER stress condition.
(A) HeLa cells were treated with the indicated concentrations of tunicamycin for 8 hr. The effective concentration of tunicamycin needed for inducing TRB3 expression was determined by densitometric image analysis. (B) CASP3/7 activity in HeLa cells was measured as described in the legend of Figure 2C, except that here apoptosis was induced by incubation with 5 µM tunicamycin for the indicated times. Each data point represents mean ±SD of three independent experiments. (C) Twenty-four hours after transfection with the indicated V5-TRB3 expression plasmid or control vector, HeLa cells were treated with tunicamycin for 48 hr. The resulting dead cells were counted by trypan blue staining. Error bars indicate mean ±SD of four independent experiments. *P<0.001. (D) Twenty-four hours after transfection with the given V5-TRB3 expression plasmid, HeLa cells were treated with TNFα/CHX or tunicamycin for the indicated times. The cell lysates were subjected to immunoblot analysis using the anti-V5 antibody. α-Tubulin was used as an internal control. (E) HeLa cells plated in 96-well plates (1.0×10⁴ cells/well) were treated with TNFα/CHX or tunicamycin for the indicated times. CASP3/7 activity was measured using the luminometric Caspase-Glo® 3/7 Assay Kit. Each data point represents mean ±SD of three independent experiments. (F-H) HeLa cells were transfected with negative control siRNA (siNC) or TRB3 siRNA (siTRB3). Twenty-four hours after, the cells were treated with tunicamycin for the indicated time points (F). The cell lysates were subjected to immunoblot analysis using the anti-TRB3 antibody (G). Cell lysates were also used for the Caspase-Glo® 3/7 assay to measure the CASP3/7 activity (H). The relative CASP3/7 activity was then determined after normalizing each value with respect to the relative amount of expressed α-Tubulin as estimated by densitometric image analysis. Each data point represents mean ±SD of three independent experiments.

