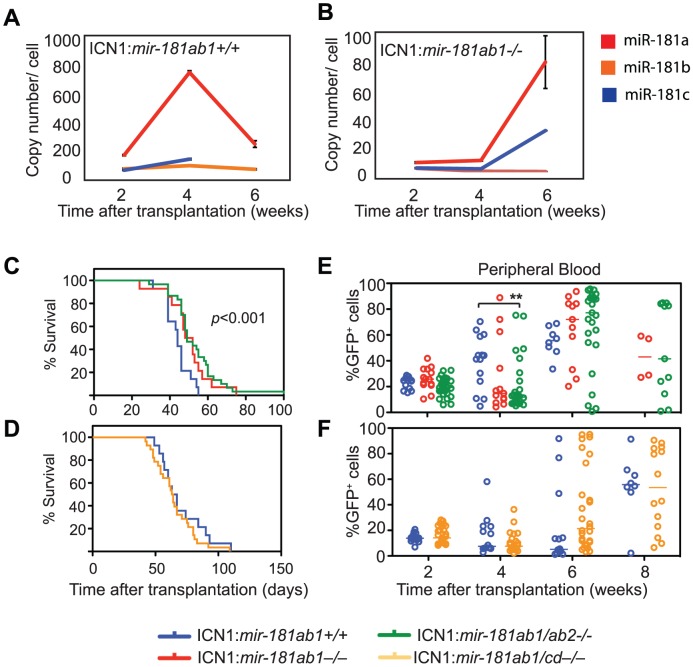
Figure 5. The differential effects of loss of individual mir-181 family genes on ICN1-induced T-ALL.
(A and B) Copy numbers of mature miR-181a, miR-181b, miR181c and miR-181d in ICN1-infected DP cells from (A) ICN1:181ab1+/+ and (B) ICN1:181ab1−/− recipient mice at 2, 4 and 6 weeks post-transplantation determined by standard curve-based miRNA qPCR analyses. (C and D) Kaplan-Meier survival curves indicate the percentage of mice (20 mice/group) surviving at different time points after reconstituting with (C) ICN1-infected mir-181ab1/ab2−/− (p<0.001) or (D) ICN1-infected mir-181ab1/cd−/− BM cells (p>0.05). (E and F) Effects of loss of mir-181 family genes on the percentage of total ICN1-infected cells (all GFP+ cells) in peripheral blood at different time points after reconstitution (**, p<0.01).

