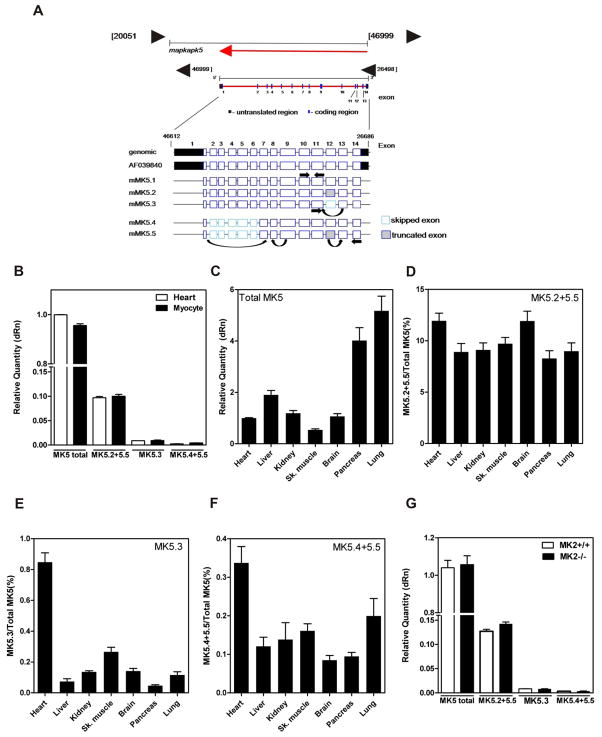
Figure 2. Detection of MK5 variants in murine tissues.
(A) Schematic representation of the intron-exon structure of MK5 showing the location of the primers used for quantification of MK5 variant mRNAs. (B) The relative abundance of spliced MK5 mRNAs was measured in total RNA isolated from murine heart and cardiac ventricular myocytes by qPCR. (C) The relative abundance of total MK5 in various murine tissues. Abundance of (D) MK5.2+MK5.5, (E) MK5.3, and (F) MK5.4+MK5.5 mRNA expressed as percentage of total MK5. (G) Detection of MK5 variants in hearts from 12-wk old MK2−/− versus MK2+/+ littermate mice. Shown are the mean ± S.E. (n=3).

