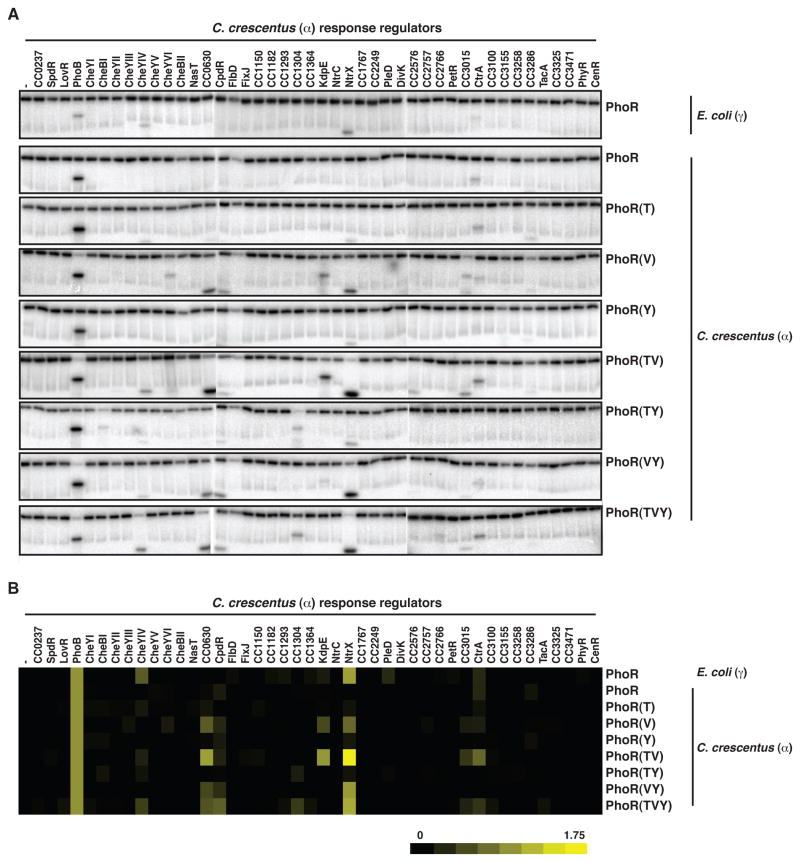
Figure 2. Substituting γ-like specificity residues into α-PhoR increases phosphorylation of NtrX.
(A) Phosphotransfer profiling of E. coli PhoR, C. crescentus PhoR, and C. crescentus PhoR mutants containing γ-proteobacterial specificity residues. Each autophosphorylated kinase, indicated on the right, was incubated with each of 44 C. crescentus response regulators, indicated across the top, for 15 minutes. (B) Quantification of profiles in panel A. Band intensities for each response regulator were normalized to the level of autophosphorylated kinase and then plotted relative to PhoB. Also see Figure S2D–E.

