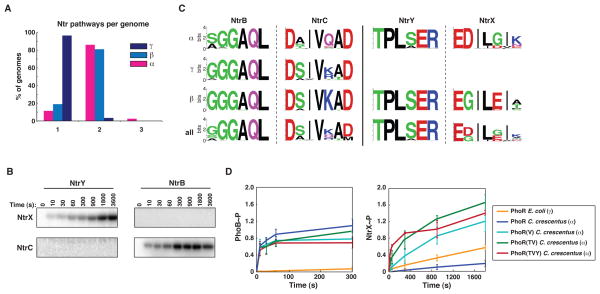
Figure 3. The divergent evolution of NtrX after duplication led initially to cross-talk with PhoR in α-proteobacteria.
(A) Percentage of genomes harboring one, two, or three Ntr pathways. (B) Time course of phosphotransfer from C. crescentus kinases NtrY and NtrB to C. crescentus response regulators NtrX and NtrC. The NtrY and NtrB constructs were autophosphorylated and examined for phosphotransfer at the time points indicated. Error bars represent standard deviations, n=3. (C) Sequence logos for specificity residues in NtrB-NtrC and NtrY-NtrX orthologs. Logos are shown for orthologs in each subdivision and as a combined set. (D) Time course of phosphotransfer from E. coli PhoR, C. crescentus PhoR, and C. crescentus PhoR mutants, listed in the legend, to C. crescentus PhoB and NtrX. Error bars represent standard deviations, n=3. Also see Figure S2A–C.

