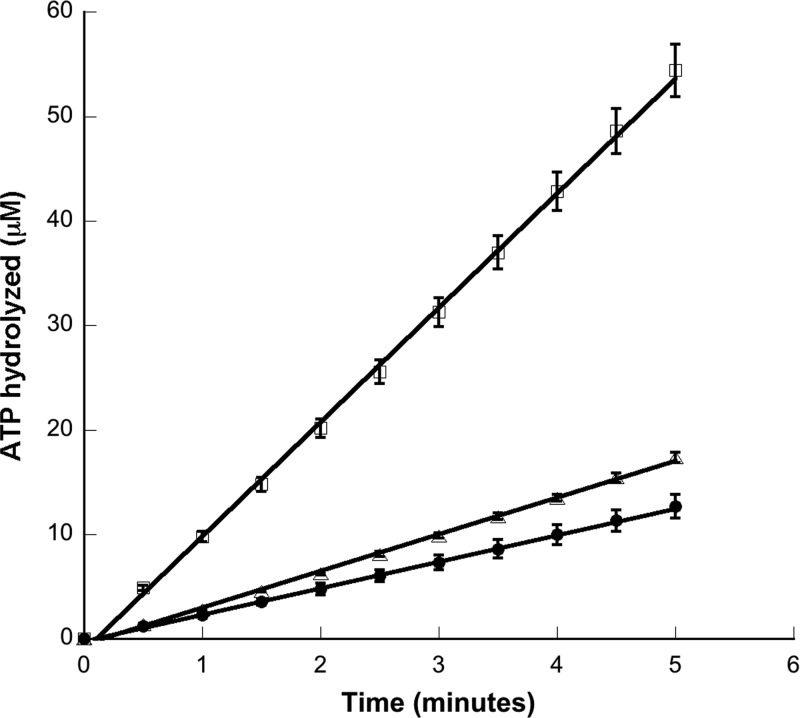
Fig 2.
ATP hydrolysis activity of GST-Nla28S. A standard colorimetric assay that couples the hydrolysis of ATP to the oxidation of NADH was used to determine ATP hydrolysis activity of GST-Nla28S-cyt. The plot shows the concentration of ATP hydrolyzed by GST-Nla28S-cyt versus the time of the reaction. The initial ATP concentrations in the reactions were 0.1 mM (filled circles), 0.3 mM (open triangles), and 2 mM (open squares). Each measurement was done in triplicate. Error bars represent standard errors of the means of three replicates.

