Fig 3.
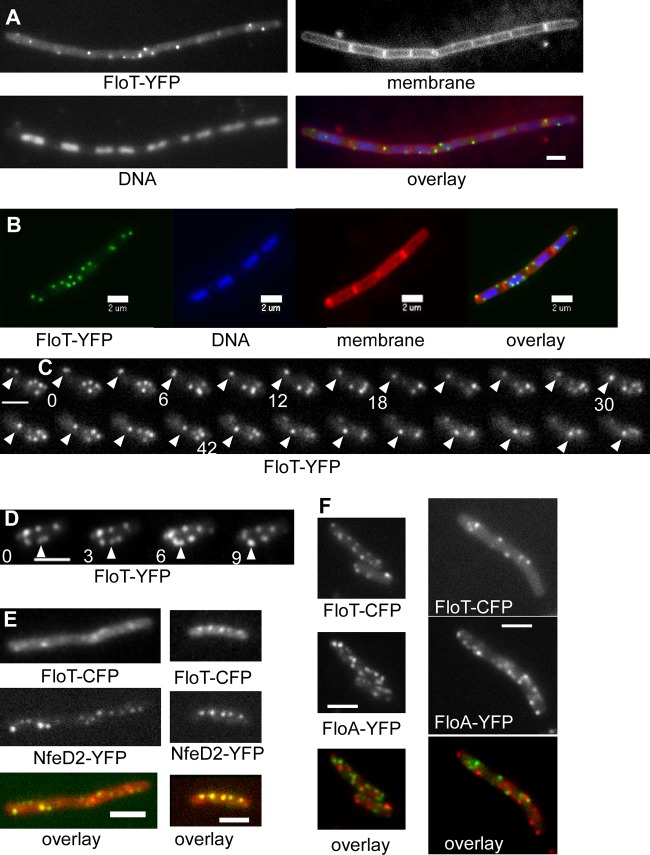
Localization of FloT by TIRF microscopy. (A and B) Localization of FloT-YFP (fully functional fusion) during exponential growth (A) and in stationary phase (B). In the overlays, FloT-YFP is green, the membrane is red, and DNA is blue. (C) Time lapse images of a cell expressing FloT-YFP. A single accumulation (indicated by the arrowheads) moves laterally within the membrane, while polar accumulations show random dynamics. (D) FloT-YFP foci represent structures that are able to fuse; note that the fused focus indicated by the arrowheads is much brighter than the two foci before fusion. The images were taken every 3 s; selected time intervals are labeled in panel C. (E) FloT-CFP and NfeD2-YFP frequently colocalize. For most FloT-CFP foci (red in overlay), there is a corresponding NfeD2-YFP focus (green in overlay; colocalizing proteins appear yellow in the overlay). (F) FloT-CFP and FloA-YFP both localize as dynamic foci, but colocalization (FloT-CFP, red, and FloA-YFP, green in overlay) is rarely observed. Bars, 2 μm.

