
Figure 1.
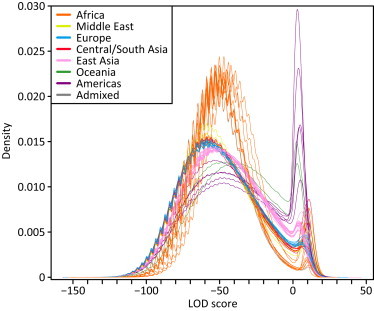
LOD-Score Distributions in 64 Populations
Each line represents the Gaussian kernel density estimates of the pooled LOD scores from all individuals in a given population, colored by geographic affiliation. The ASW and MXL admixed populations appear in gray. The periodicity of each density is a consequence of the resampling approach used to estimate allele frequencies.