
Figure 5.
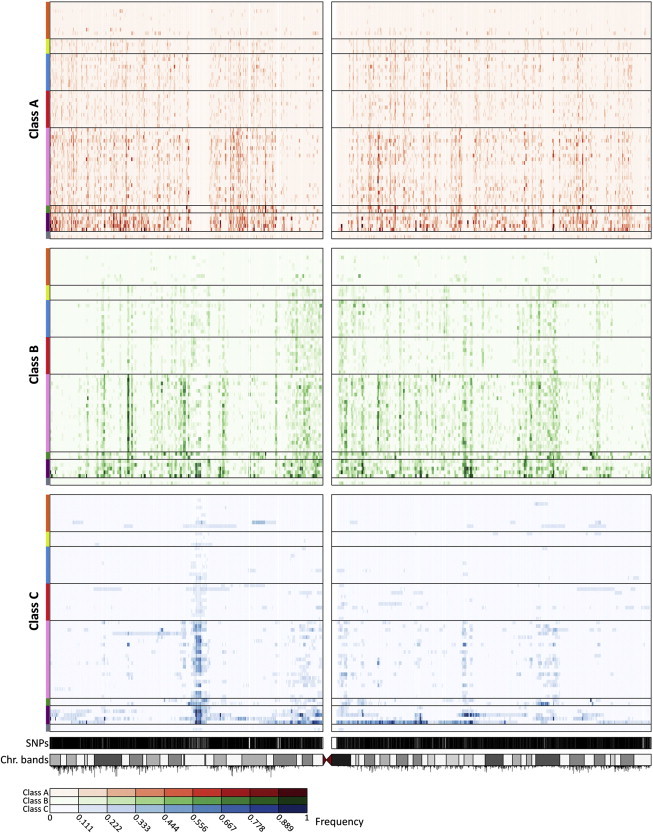
Distribution of ROH Frequency across Chromosome 3 for Each ROH Class
For each ROH class, for each population, at each SNP, the proportion of individuals in that population who have an ROH encompassing the SNP is plotted. Each row represents a population, and each column represents a genotyped SNP position. The intensity of a point increases with increasing ROH frequency, as indicated by the color scale below the figure. Populations are ordered from top to bottom by geographic affiliation, as indicated by colored bars on the left, and within regions from top to bottom by increasing geographic distance from Addis Ababa (in the same order as in Figure 3). SNP positions and the ideogram of chromosome banding are in the bottom tracks. Recombination rates are represented by vertical black lines below the ideogram, with line heights proportional to recombination rates.