
Figure 6.
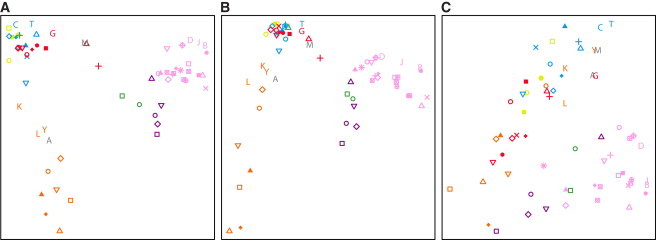
Geographic Groupings in the Distribution of ROH Frequencies across the Genome
The first two dimensions of a multidimensional scaling analysis of pairwise correlations between genome-wide ROH frequencies in individual populations are shown for: (A) class A, (B) class B, and (C) class C ROH. Populations are indicated by the same symbols as in Figure 4.