
Figure 7.
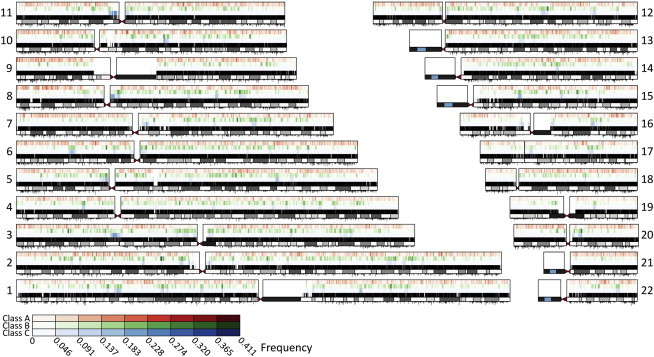
Distribution of Worldwide Mean ROH Frequency across the Genome
For each chromosome, the figure shows the ROH frequency for class A (top), class B (middle), and class C (bottom). SNP position, chromosome banding, and recombination rates are shown as in Figure 5.