
Figure 9.
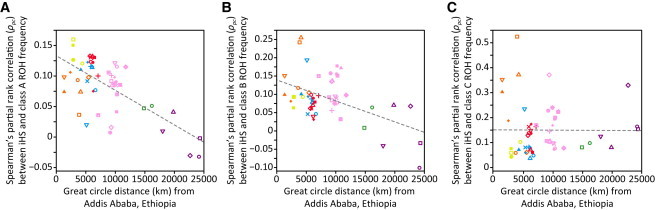
Relationship between iHS Selection Scores and ROH Frequencies in the 53 HGDP-CEPH Populations
The decrease of the Spearman’s partial rank correlation between iHS and ROH frequency with geographic distance from Addis Ababa is shown for (A) class A (R2 = 0.468), (B) class B (R2 = 0.253), and (C) class C (R2 = 0.001) ROH. Populations are indicated by the same symbols as in Figure 4. Most correlations had p < 0.05 (exceptions: A, Naxi and Surui; B, Papuan).