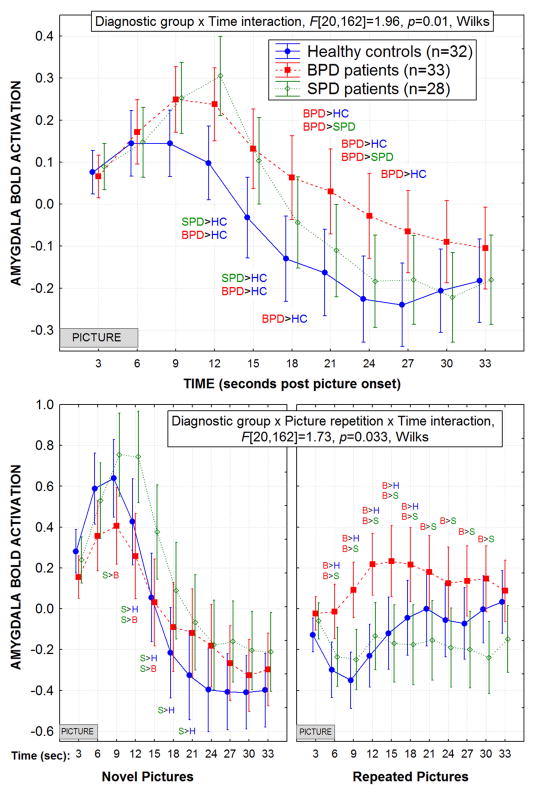
Figure 1.
Top: The amygdala BOLD response curve is shown for each of the three groups averaged across all repeated measures (picture type, repetition, startle/no startle, and hemisphere) except for Time (3, 6, 9…33 sec following picture onset). The amygdala was hand traced on each individual study participant’s structural MRI (MP-RAGE) and co-registered to their EPI scan. The borderline personality disorder (BPD) patients showed an amygdala response curve which peaked later than the healthy controls and took longer to return to baseline compared with both healthy controls and schizotypal personality disorder (SPD) patients. This BPD-related pattern of a protracted amygdala response is consistent with the concept that BPD patients have long-lasting responses to emotional stimuli. The SPD patients showed the longest peak latency and highest peak response in the amygdala while the controls showed the shortest peak response and lower overall BOLD activation in the amygdala. As shown, this Group × Time interaction was significant. For both graphs, the significant post-hoc Fisher’s LSD tests, p<0.05 are noted and the standard error bars are provided.
Bottom: The BPD group showed a greater overall BOLD response in the amygdala during the repeated pictures compared with both the healthy controls and the SPD patients. In contrast, the SPD group showed a higher peak during the novel pictures. As shown, this Group × Picture repetition (novel, repeated) × Time interaction was significant.

