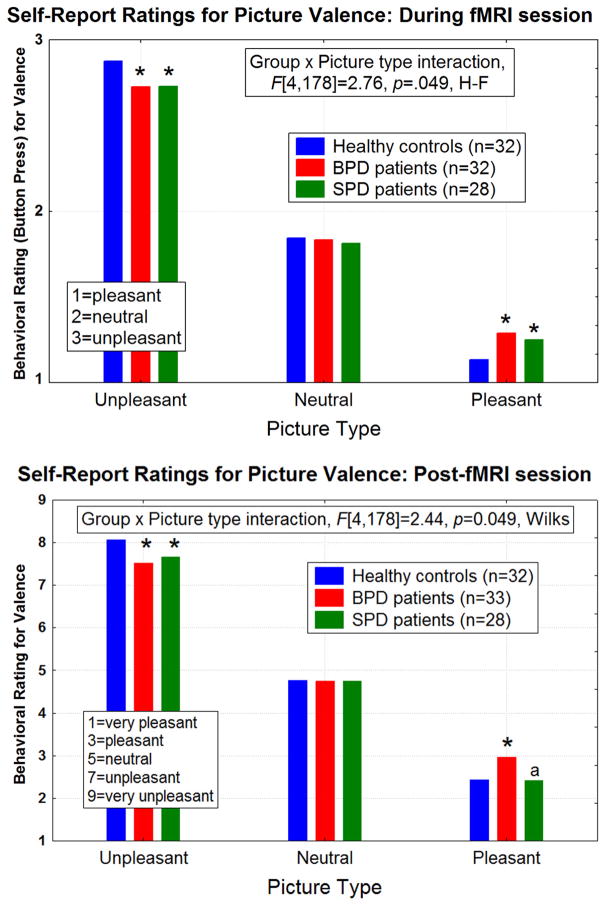
Figure 4.
Group means for the self-report ratings of picture valence are shown for the pictures viewed in the magnet (Top graph) and following the fMRI session (Bottom graph using the Self-Assessment Manikin (SAM) scale (47)). There were no between-group differences for the neutral picture ratings. Both Group × Picture type interactions are significant as shown.
Top: During the fMRI session, both the borderline personality disorder (BPD) and schizotypal personality disorder (SPD) groups showed blunted (i.e. rated unpleasant and pleasant as more neutral) self-report ratings of the emotional pictures compared with healthy controls. Asterisks denote significant differences from the healthy controls (follow-up Fisher’s LSD tests), all p-values<0.007.
Bottom: Similarly, the post-fMRI session self-report ratings show that compared with the healthy control group, both the BPD and SPD groups exhibited a blunted response pattern to the unpleasant pictures. BPD patients also showed a blunted response for the pleasant pictures compared with healthy controls and SPD patients. Asterisks denote significant differences from the healthy controls (Fisher’s LSD tests, all p-values<0.007). The “a” represents BPD>SPD, p=0.0002.

