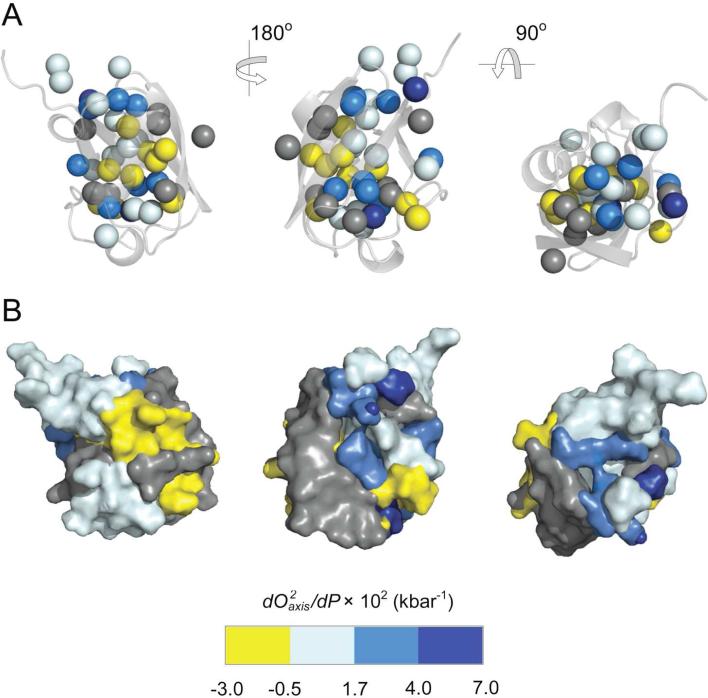
Figure 5.
Spatial distribution of the pressure sensitivity of fast methyl-bearing side chain motion in ubiquitin. (A) Different orientations of the crystal structure of ubiquitin51 (PDB 1UBQ) represented as a ribbon with side chain methyl carbons shown as spheres and colored according to their membership in the numeric groups derived from k-means clustering of (dO2axis/dP) values (see Methods). Methyl groups showing a reduction in the amplitude of motion with increasing pressure (dO2axis/dP > 0) are colored with a white-blue scheme while those having an increase in motion with increasing pressure (dO2axis/dP <0) are colored yellow. Those methyls having a non-linear dynamic response to pressure were grouped separately and are colored gray. Statistical tests confirm the members of each numerical group (excluding T22γ2, L8δ1, L73δ2) of dO2axis/dP values are also spatially clustered within the molecular structure (all p < 0.05), reflecting regions of variable compressibility. See Figure S4 also. These clusters of apparent compressibility are emphasized in (B) where each atom, including added hydrogens, was assigned to the cluster of the nearest methyl carbon probe. Hydrogen atoms were added and surface renderings were then made for each group and colored accordingly. Molecular images were generated using PyMOL (Schrödinger, Portland).

