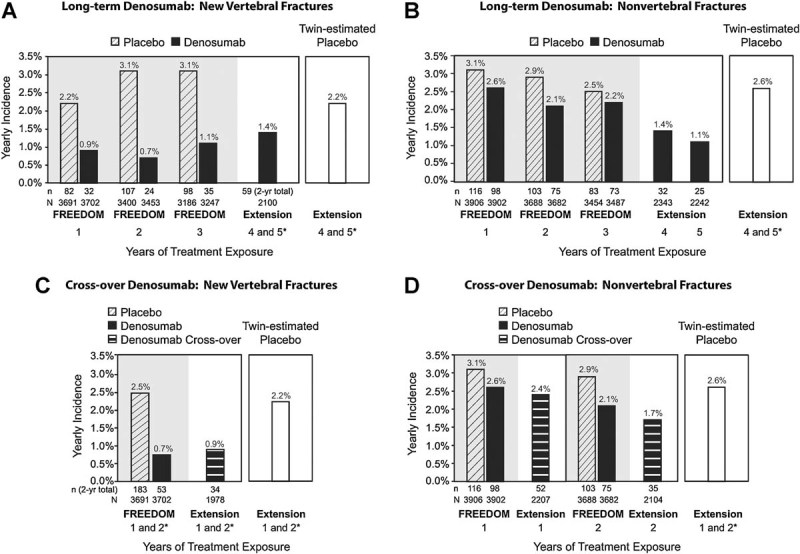
Fig. 5.

Yearly incidence of new vertebral fractures (A and C) and nonvertebral fractures (B and D) during FREEDOM and the extension. n = number of subjects with ≥1 fracture. N = number of subjects in the primary efficacy analysis set who were still on study at the beginning of each period. *Annualized rate: (2-year rate/2).
