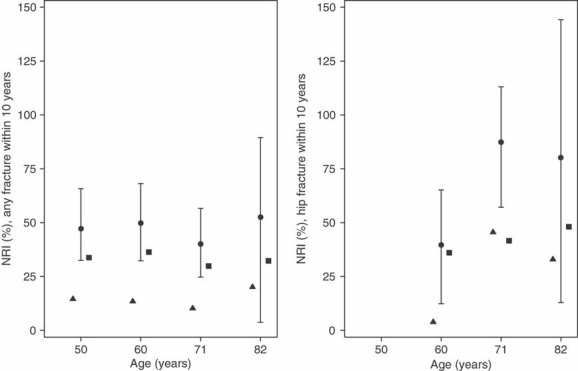
Figure 4.

Net reclassification improvement (NRI). NRI for prediction of any fracture (left panel) and hip fracture (right panel) when comparing the full model with FRAX variables (VFRAX). Triangles (▴) represent NRI among events, squares (▪) NRI among nonevents, and circles (•) the combined NRI with 95% confidence interval error bars.
