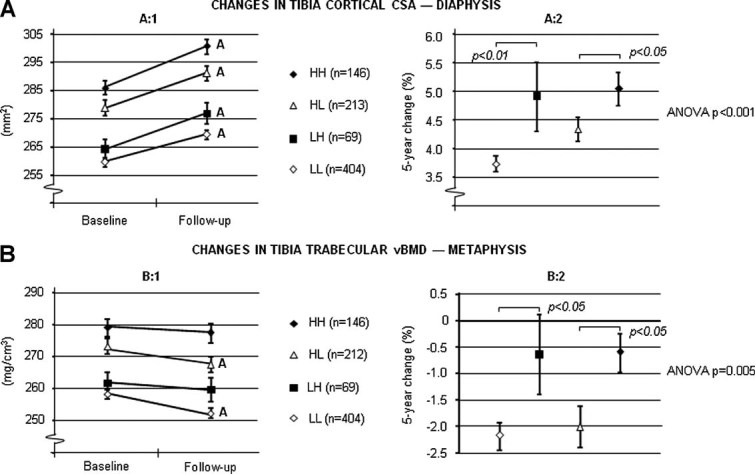
Fig. 3.

Five-year changes in (A) cortical CSA and (B) trabecular volumetric BMD of the tibia according to changes in physical activity. Consistently high (HH), consistently low (LL), changed from high to low (HL), and changed from low to high (LH) amount of physical activity in relation to sports. Values are given as mean ± SEM. Letters represent p < 0.001.
