
Figure 4.
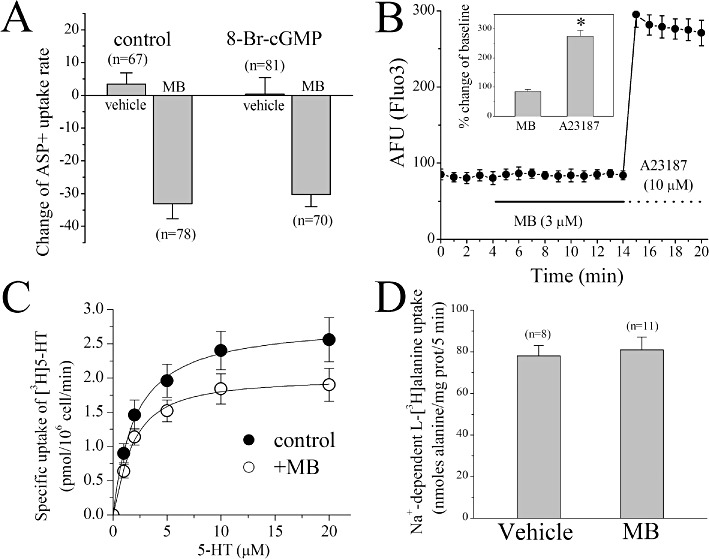
The effects of MB on [3H]5-HT uptake, [3H]alanine uptake and intracellular Ca2+ levels and the influence of cGMP on MB inhibition of hSERT function. (A) The effects of 5 min application of 3 µM MB with vehicle or pretreatment with 8-Br.cGMP (10 min; 100 µM). Data points represent the mean ± SEM of three different experiments. The numbers of cells are presented above each data point. (B) The effect of 5 min application of 3 µM MB on intracellular Ca2+ levels in Fluo3-AM (10 µM) loaded cells. Data points indicate the mean ± SEM fluorescent intensity (AFU) from 11 cells. Inset shows percent changes in the presence of MB (5 min, 3 µM) or A23187 (5 min, 10 µM) compared with baseline values at 4 min. *P < 0.01, significantly different. (C) EM4 cells stably expressing hSERT (105 cells per well) were incubated in a final volume of 0.1 mL containing the indicated concentrations of [3H]5-HT in the absence or presence of 3 µM MB for 1 min at 22°C. Non-specific uptake (measured in the presence of 1 µM paroxetine) was less than 10% and was subtracted. The symbols represent mean ± SEM of three experiments carried out in triplicate. (D) The effects of 10 min application of 10 µM MB on Na+-dependent [3H]alanine uptake. Data points represent the mean ± SEM of three different experiments. The numbers of cells are presented above each data point.